

Working with Totals
This page includes the following sections:
- More Total Options Dialog
- Show Totals
- Total Type
- Logic Options
- Visual Totaling
- Totals with Filters, Sorts and Eliminations
More Total Options Dialog
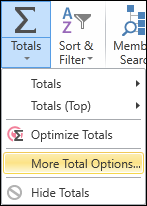
To access the More Total Options dialog:
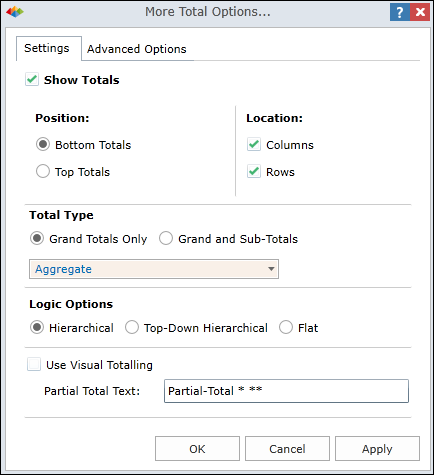
The More Total Options dialog contains ALL of the totalling commands and options, as described below.
Show Totals
Turns totals on/off.
Position
Bottom Totals
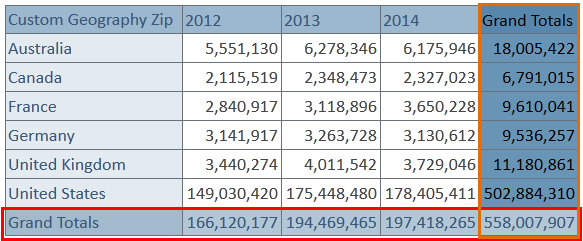
Positions totals after the data being totaled:
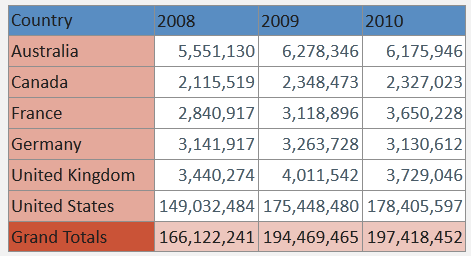
- A row containing totals will appear below the other rows, as shown in red below.
- A column containing totals will appear to the right of the other columns, as shown in orange below.
Top Totals
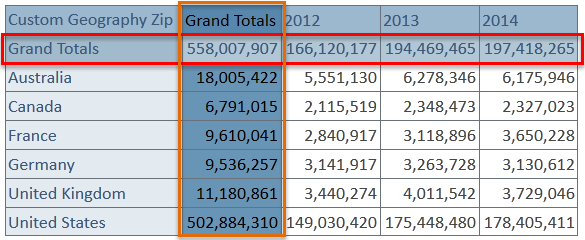
Positions totals before the data being totaled:
- A row containing totals will appear above the other rows, as shown in red below.
- A column containing totals will appear to the left of the other columns, as shown in orange below.
Location
Columns
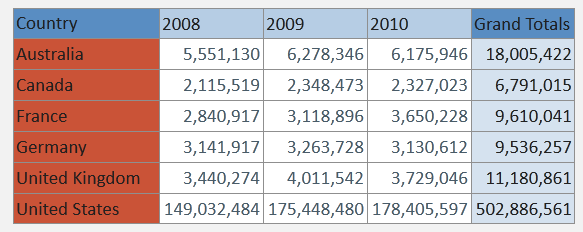
Check Columns to calculate totals for each column. Results are displayed in a single row, as shown below.
Rows
Check Rows to calculate totals for each row. Results are displayed in a single column, as shown below.
Total Type
Grand Totals Only
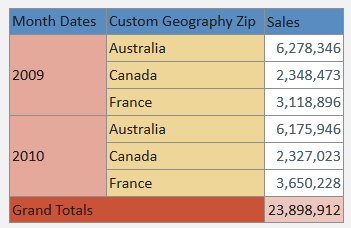
Displays Grand Totals only, as shown below.
Grand and Sub-Totals
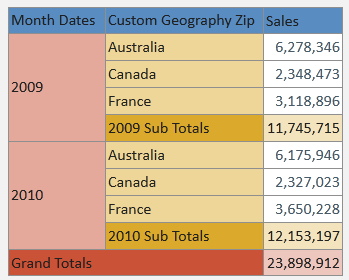
Displays both Grand Totals and Sub-Totals, as shown below.
Aggregation Type
Select the desired aggregation type for calculating totals:
- Aggregate (default) - Uses the aggregation type defined within the source database.
- Count - Displays the number of contributing cells. Empty cells are NOT counted.
- Average - Displays the average value of the contributing cells. Empty cells are NOT included in calculation.
- Maximum - Displays the max value from among the contributing cells.
- Minimum - Displays the min value from among the contributing cells.
- Median - Displays the median value of the contributing cells. Empty cells are NOT included in calculation.
- Standard Deviation - Displays the standard deviation between the contributing cells. Empty are NOT included in calculation.
- Sum - Displays the sum of the contributing cells.
Logic Options
There are several logic options that can be used in generating totals. Since hierarchical data structures can be selected and presented in query results using multiple configurations, there is a need for a variety of totaling approaches (depending on the analytic requirements).
- Hierarchical - Runs bottom up (default).
- Top-Down Hierarchical - Runs top-down.
- Flat - Totals all displayed cells (regardless of hierarchy).
Hierarchical
Choose Hierarchical (the default method) to perform totaling based on the query result, adding elements from the bottom up of the tree. This approach IGNORES parent elements in the result set and is the most accurate method for hierarchical selections, especially when there are ragged (imbalanced) selections.
NOTE: Hierarchical can be slow to process when working with exceptionally large trees or results.
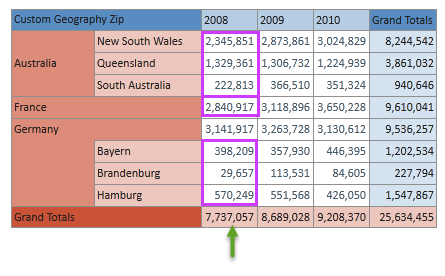
In the example below, the sales figures are totaled for:
- Three individual states in Australia. (The other states of Australia are not part of the query and are therefore not included in the totals.)
- The country of France.
- Three individual states in Germany. (The other states of Germany are not part of the query and are therefore not included in the grid. The total figure for Germany 3,141,917 figure far exceeds the combined total of the three states, since there are other German states that are not in the query. The 3,141,917 figure is not included in the total.)
NOTE: In contrast to Hierarchical totaling, read how to Use Visual Totaling.
Top-Down Hierarchical
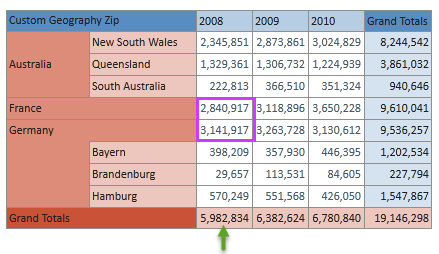
Choose Top-Down Hierarchical to perform totaling based on the query result, adding elements from the top down of the tree. This approach counts only the OUTER layer of elements in the result set and will be accurate when parents are selected (for any children that are selected in the query).
In the example below, the overall sales figures for the countries France and Germany are added together to produce the total. Australia has not been included since the parent level is not selected.
NOTE: Top-Down Hierarchical can sometimes perform faster than standard Hierarchical when there are large trees or results.
Flat
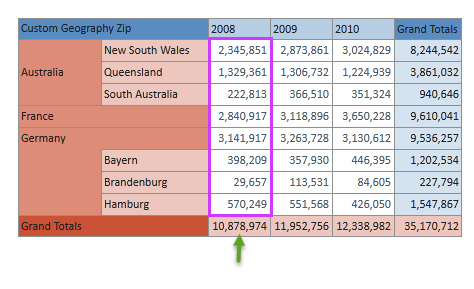
Choose Flat to perform totaling using all displayed cells regardless of the hierarchy. This method may be handy when trying to produce totaling options such as averages (where the hierarchical delineation is not required).
In the example below, all the elements are included in the total. While the math is correct, the logic is inaccurate since the overall Germany country figure is included (in addition to the three German states that have been selected).
Visual Totaling
There are two options related to the display of visual totals within the grid:
- Use Visual Totaling - Calculates parent totals USING visible children only.
-
Partial Total Text - Allows entry of customized text within grid.
Use Visual Totaling
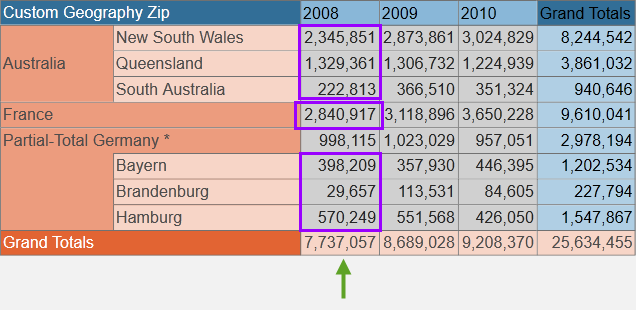
Choose Use Visual Totaling to perform visual totaling adjustments based on the visible query results. In the example below, the German partial total includes the three VISIBLE states of Bayern, Brandenburg and Hamburg only (since these are the only states in the query). All other states are excluded from German totals. The term "Partial Total" and the asterisk draw attention to the fact that visual totaling is being used.
The Visual Totaling option can be selected in combination with the other Logic Options. In the example show above, visual totaling is used together with the Hierarchical logic option to avoid double counting Germany. The Partial Total Germany figure (998,115) appears as a visual aid for the user, but is not counted in the totals.
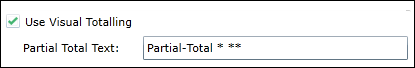
Partial Total Text
The Partial Total Text box contains the text that will be displayed within the query to indicate that there is a partial visual total.
- A single asterisk (*) causes the element's hierarchy name.
- A double asterisk (**) causes an asterisk sign to appear in the grid.
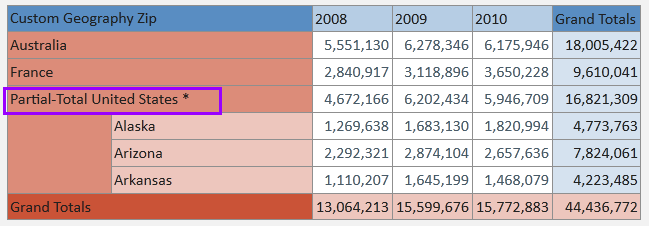
EXAMPLE OF DEFAULT TEXT
- Default text is "Partial-Total".
- Element name is "United States".
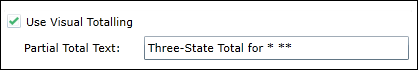
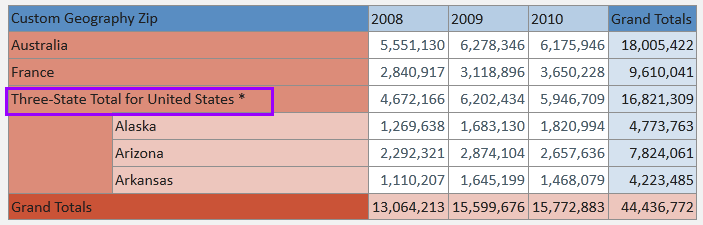
EXAMPLE OF CUSTOMIZED TEXT
- Customized text is "Three-State Total for".
- Element name is "United States".
Totals with Filters, Sorts and Eliminations
Grand totals can function together with filtering, sorting and elimination. However, these functions will NOT work with the sub-totaling option. If users attempt to include both items in a query, the application will prompt to remove one or the other.
Example
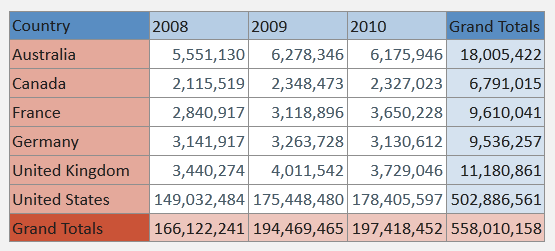
This example displays Grand Totals of yearly sales for six countries.
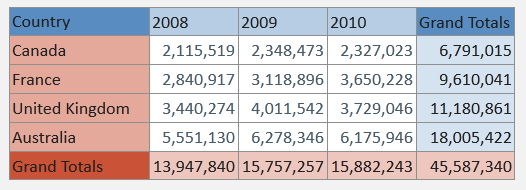
We now perform a filter, a sort and an elimination:
- We filter out rows with yearly sales over 20,000,000. The row containing United States is filtered out.
- We sort rows based on the 2008 values.
- We eliminate the row containing sales figures for Germany.
Note that the Grand Totals displays accurate visual totals based on current grid content.
 '
'
Home |
Table of Contents |
Index |
User Community
Pyramid Analytics © 2011-2022